Dashboard
Start csls in an editor, then attach the dashboard to the active session:
csls dashboardPass --session when more than one language server is running:
csls dashboard --session 12345You can also select the session that owns a workspace or document:
csls dashboard --workspace src/MyApp/MyApp.csprojThe dashboard reads the same versioned control service used by the CLI and MCP server. It shows sessions, workspaces, projects, documents, diagnostics, requests, queues, build hosts, caches, bounded structured logs, and bounded request traces.
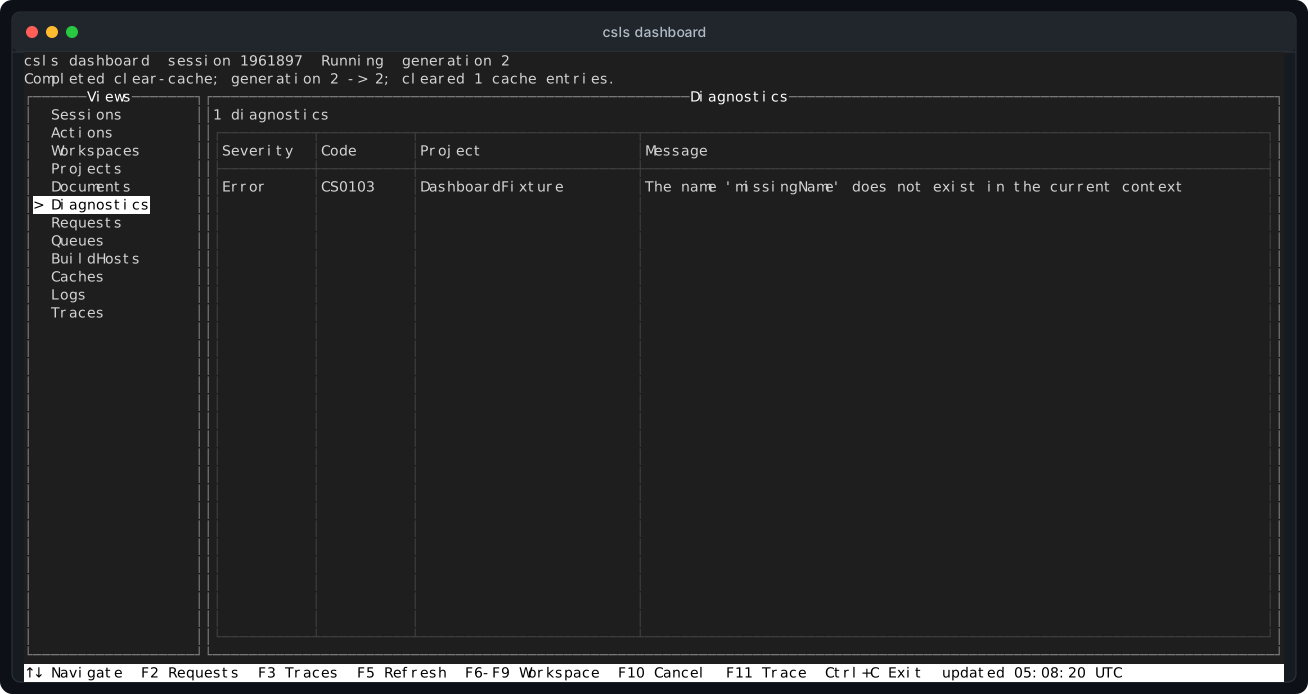
Click the screenshot for the full-size view. The capture comes from the real dashboard integration test and includes a Roslyn diagnostic from the connected workspace.
Use the arrow keys to select a view. Press F2 for live requests, F3 for traces, F5 to refresh, and Ctrl+C to exit. Diagnostics are evaluated when their view is selected so normal attachment does not compile every loaded project.
The Actions view can restore or reload a workspace, restart its Roslyn build hosts, and clear retained results. Every mutation opens a confirmation window. The same actions are available from F6 through F9. Reload and host restart preserve unsaved document text owned by the editor.
Press F10 to confirm cancellation of the oldest active request. Press F11 to confirm starting or stopping request tracing. Cancellation uses the correlation identifier shown in the Requests view. Trace entries include the request name, final state, duration, and the same correlation identifier.